Introduction
Some of the recent queries from members of the litmuschaos community have been around how they can observe the impact of chaos. The frequency of these queries coupled with the feedback we got from several litmus users (like the SREs at F5 Networks) resulted in some interesting features and also triggered off several meetup appearances discussing precisely this: “Observability Considerations in Chaos Engineering”. This blog (and a few that will follow) is a summarization of those discussions and an attempt to define what observability means in the context of chaos & what hooks litmus provides in this area.
What we will not do is define either observability (read this extremely insightful blog by Cindy Sridharan) or chaos (we have done this ad-nauseam in the other litmus blogs) individually :)
Observability in Chaos Engineering
Observability ties in with chaos engineering in a couple of major ways:
(A) Chaos testing of your Observability infrastructure
Are you getting the right metrics, is all information logged correctly, do you have the notifications/alerts arriving as expected?. It is often the easiest way to introduce a chaos engineering practice in an organization. And this is a view shared by many devops engineers we have spoken to over the years. The value demonstrated here gives the stakeholders the confidence to try it on real business applications sooner rather than later. Having said that, if the business app happens to be an observability solution - even better ;)
(B) Observability infra as supportive tooling to visualize chaos & validate the hypothesis
Chaos experimentation is a lot about hypothesizing around the application and/or infrastructure behavior, controlling blast radius & measuring SLOs. SREs love to visualize the impact of chaos - either actively (live) or recorded (as with automated chaos tests)
Point (A) is more about process, culture, and engineering ethos while (B) is a technical requirement asked of the chaos-framework with respect to what hooks it provides for generating observability data & also consuming it from the environment it is deployed into.
We have had some interesting use cases of (A) in the litmus community - notably Zebrium using it to verify if their ML-based autonomous monitoring solution functions effectively and Intuit using litmus to test the resilience of their Prometheus & Wavefront cluster add-ons.
As far as (B) goes, until quite recently (a few months past) Chaos (K8s) Events was the only observability element generated by Litmus microservices (metrics were mostly rudimentary) and the users needed additional aids such as the Heptio event router to convert these Kubernetes events into metrics in order to bring them onto their dashboards. There have been some cool developments since.
Let me explain them in more detail.
Improved Litmus Chaos Exporter to create Chaos-Interleaved dashboards
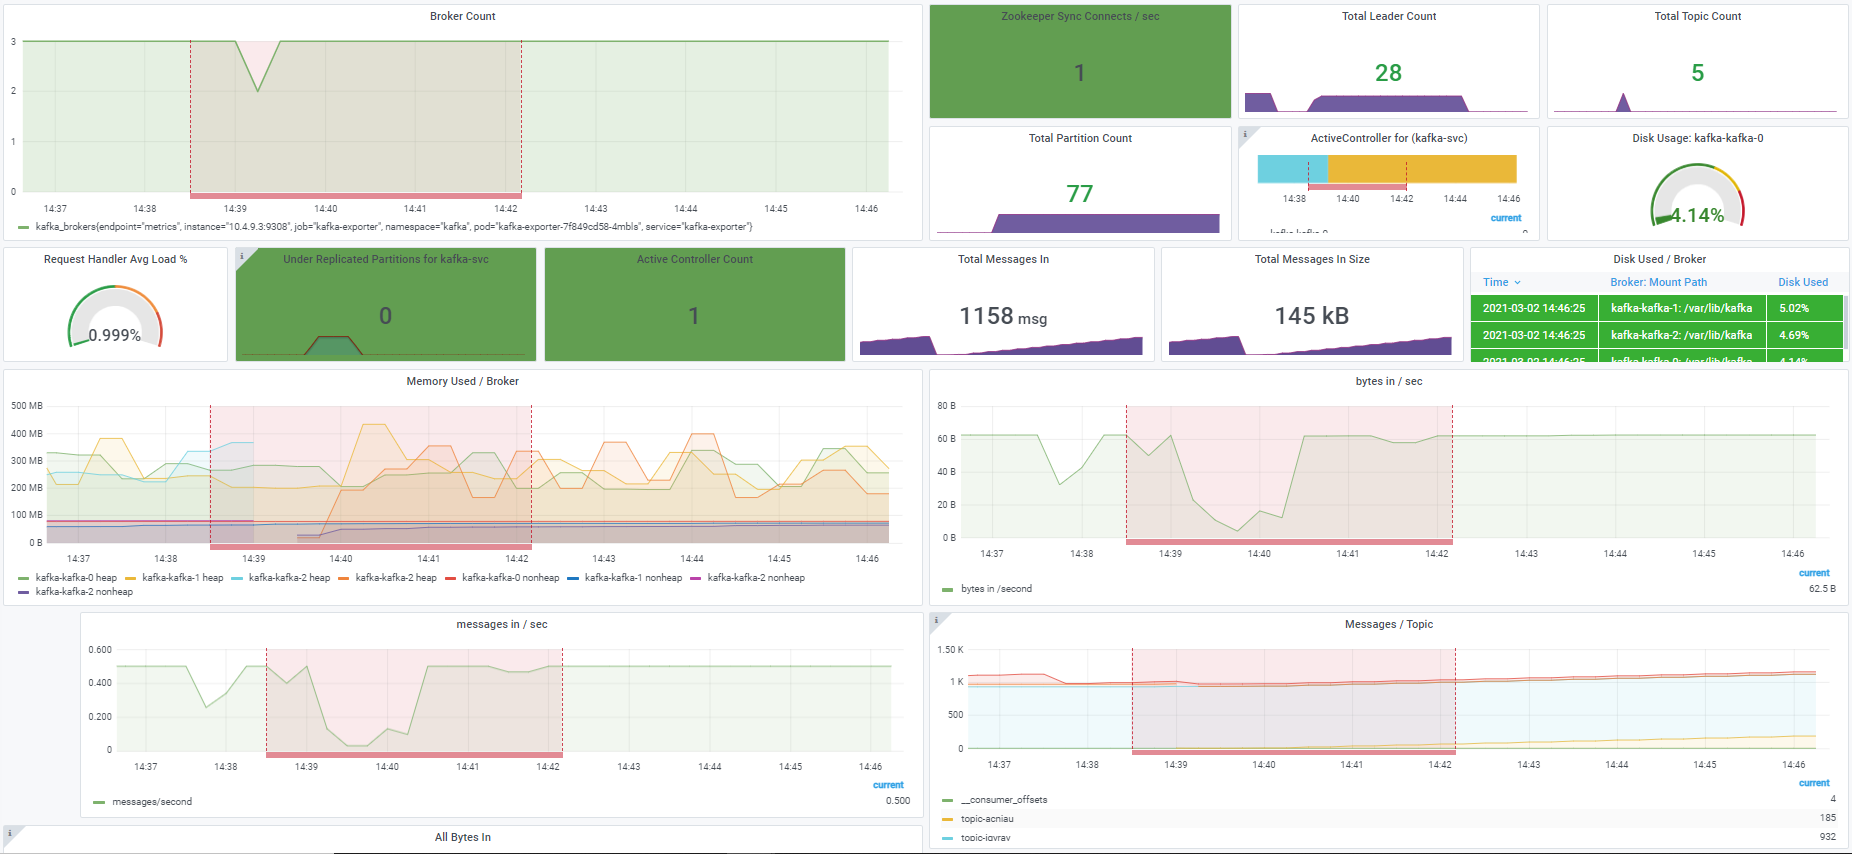
Chaos interleaved dashboards (i.e., instrumented app dashboards/panels with prom functions on chaos metrics in order to indicate the period of chaos injection/experiment execution) is something that has been in practice and, like mentioned previously, used the event router. While this did help, it was by no means a perfect solution - as upstream implementations of the event-router didn’t have the desired event filtering capabilities (leading to more space on the TSDB) and events are relatively ephemeral entities that disappear from the etcd after a specified period of time. As a result, the chaos exporter was improved to generate more meaningful metrics to indicate the state & results of the chaos experiments - the source being a richer (schema-wise) ChaosResult CR.

These metrics (especially litmuschaos_awaited_experiments) can be used to annotate your dashboards to view the application behavior during the chaos period. Here is a sample Kafka dashboard interleaved with chaos metrics:

You can find references for this dashboard here.
Automated Validation of Hypothesis
Oftentimes, chaos experiments are automated and there is a need to record application behavior (and any other environmental factors worth observing, depending on the usecase) to determine whether an experiment was successful in proving a “Hypothesis”. The hypothesis can be defined as the expectation you, the chaos practitioner (developer, SRE) have from your system under the chaotic condition it is subjected to. Typically, it involves the following:
- (a) Defining a Steady State for your application/infrastructure
- (b) Anticipated deviation from Steady State
It may also involve other expectations around (a) & (b) such as expected MTTD (mean time for detection of failures and beginning of recovery flow within a self-healing infrastructure), MTTR (Mean Time to Recover and get back to Steady-State and Optimal Operational Characteristics). These details are typically expressed as application metrics via respective exporters/plugins.
It is also possible to have other notions of Steady-State - the range can be as diverse as availability of a downstream microservice, custom app status retrieved via dedicated CLI, values for different status fields on Kubernetes Custom Resources (especially with operators doing lifecycle management of apps), etc., (you can find more details about this here). However, for a majority of the cases, these tend to be auxiliary checks over the course of an experiment, with the core constraints of the steady-state hypothesis revolving around app metrics.
The promProbe was introduced to address this very requirement. With this probe, users can define an expected value (or range) for app metrics (that are queried from a Prometheus end-point) via promQL queries at various stages of the experiment execution (before/after chaos OR through the chaos period). The success of the probe determines the eventual “verdict” of the experiment.

You can find references for this probe definition here.
Conclusion
Observability has many more facets than just metrics: such as logs, traces, events. Analytics too is slowly being drafted in as an element of (or at least at the periphery of) observability in recent times. In subsequent blog posts, we will discuss what Litmus has to offer in these areas and what improvements we are looking at.
Are you an SRE or a Kubernetes enthusiast? Does Chaos Engineering excite you? Join Our Community #litmus channel in Kubernetes Slack Contribute to LitmusChaos and share your feedback on Github If you like LitmusChaos, become one of the many stargazers here.
