Chaos Workflows are now replacing traditional experiments for injecting chaos into complex systems running in a Kubernetes environment. A simple result schema is not always the mirror to a system’s reliability, especially when the fault injections are periodic or more than one microservice is subjected to chaos and monitored for performance metrics. The chaos often tends to disrupt tightly coupled microservices and processes. Visualizing the results and plotting analytical graphs prove to be useful under such circumstances.
How Litmus helps?
LitmusChaos brings these features to SREs and DevOps engineers packed with the Litmus Portal, a GUI to orchestrate complex chaos workflows, monitor chaos events and metrics around chaos experiment. Along with features such as MyHub (your personal ChaosHub for housing custom resources) and team management, Chaos analytics goes a long way to open the world of chaos engineering to a large number of teams and organizations with different use cases and business or operational requirements.
Data science for cloud-native workloads
Data visualization and analysis are some building blocks for analytics and a stepping stone to Machine learning and AIOps. It helps in better analysis, quick action, identifying patterns, finding errors, understanding the story, exploring business insights and grasping the latest trends. With chaos-engineering in the view, analysing results of complex tests and workflows over a specific time duration is a great value add to many DevOps personas. Monitoring the system’s behaviour under chaos over a development period reveals the applications resilience and its development pros and also the shortcomings such as coupling and tolerance thresholds.
Data crunching in Litmus Portal
An analytical overview of chaos workflows for an entire month or a year can help in benchmarking release cycles and building a viable cloud-native product. Also a comparative study over time or rather just being able to observe and plot resiliency scores across different types of chaos workflows on different subsystems provide a conclusive summary of the reliability metrics. LitmusChaos portal comes with all these features readily available and easy to use both for a novice and a chaos engineering expert.
Accessing analytics on the GUI
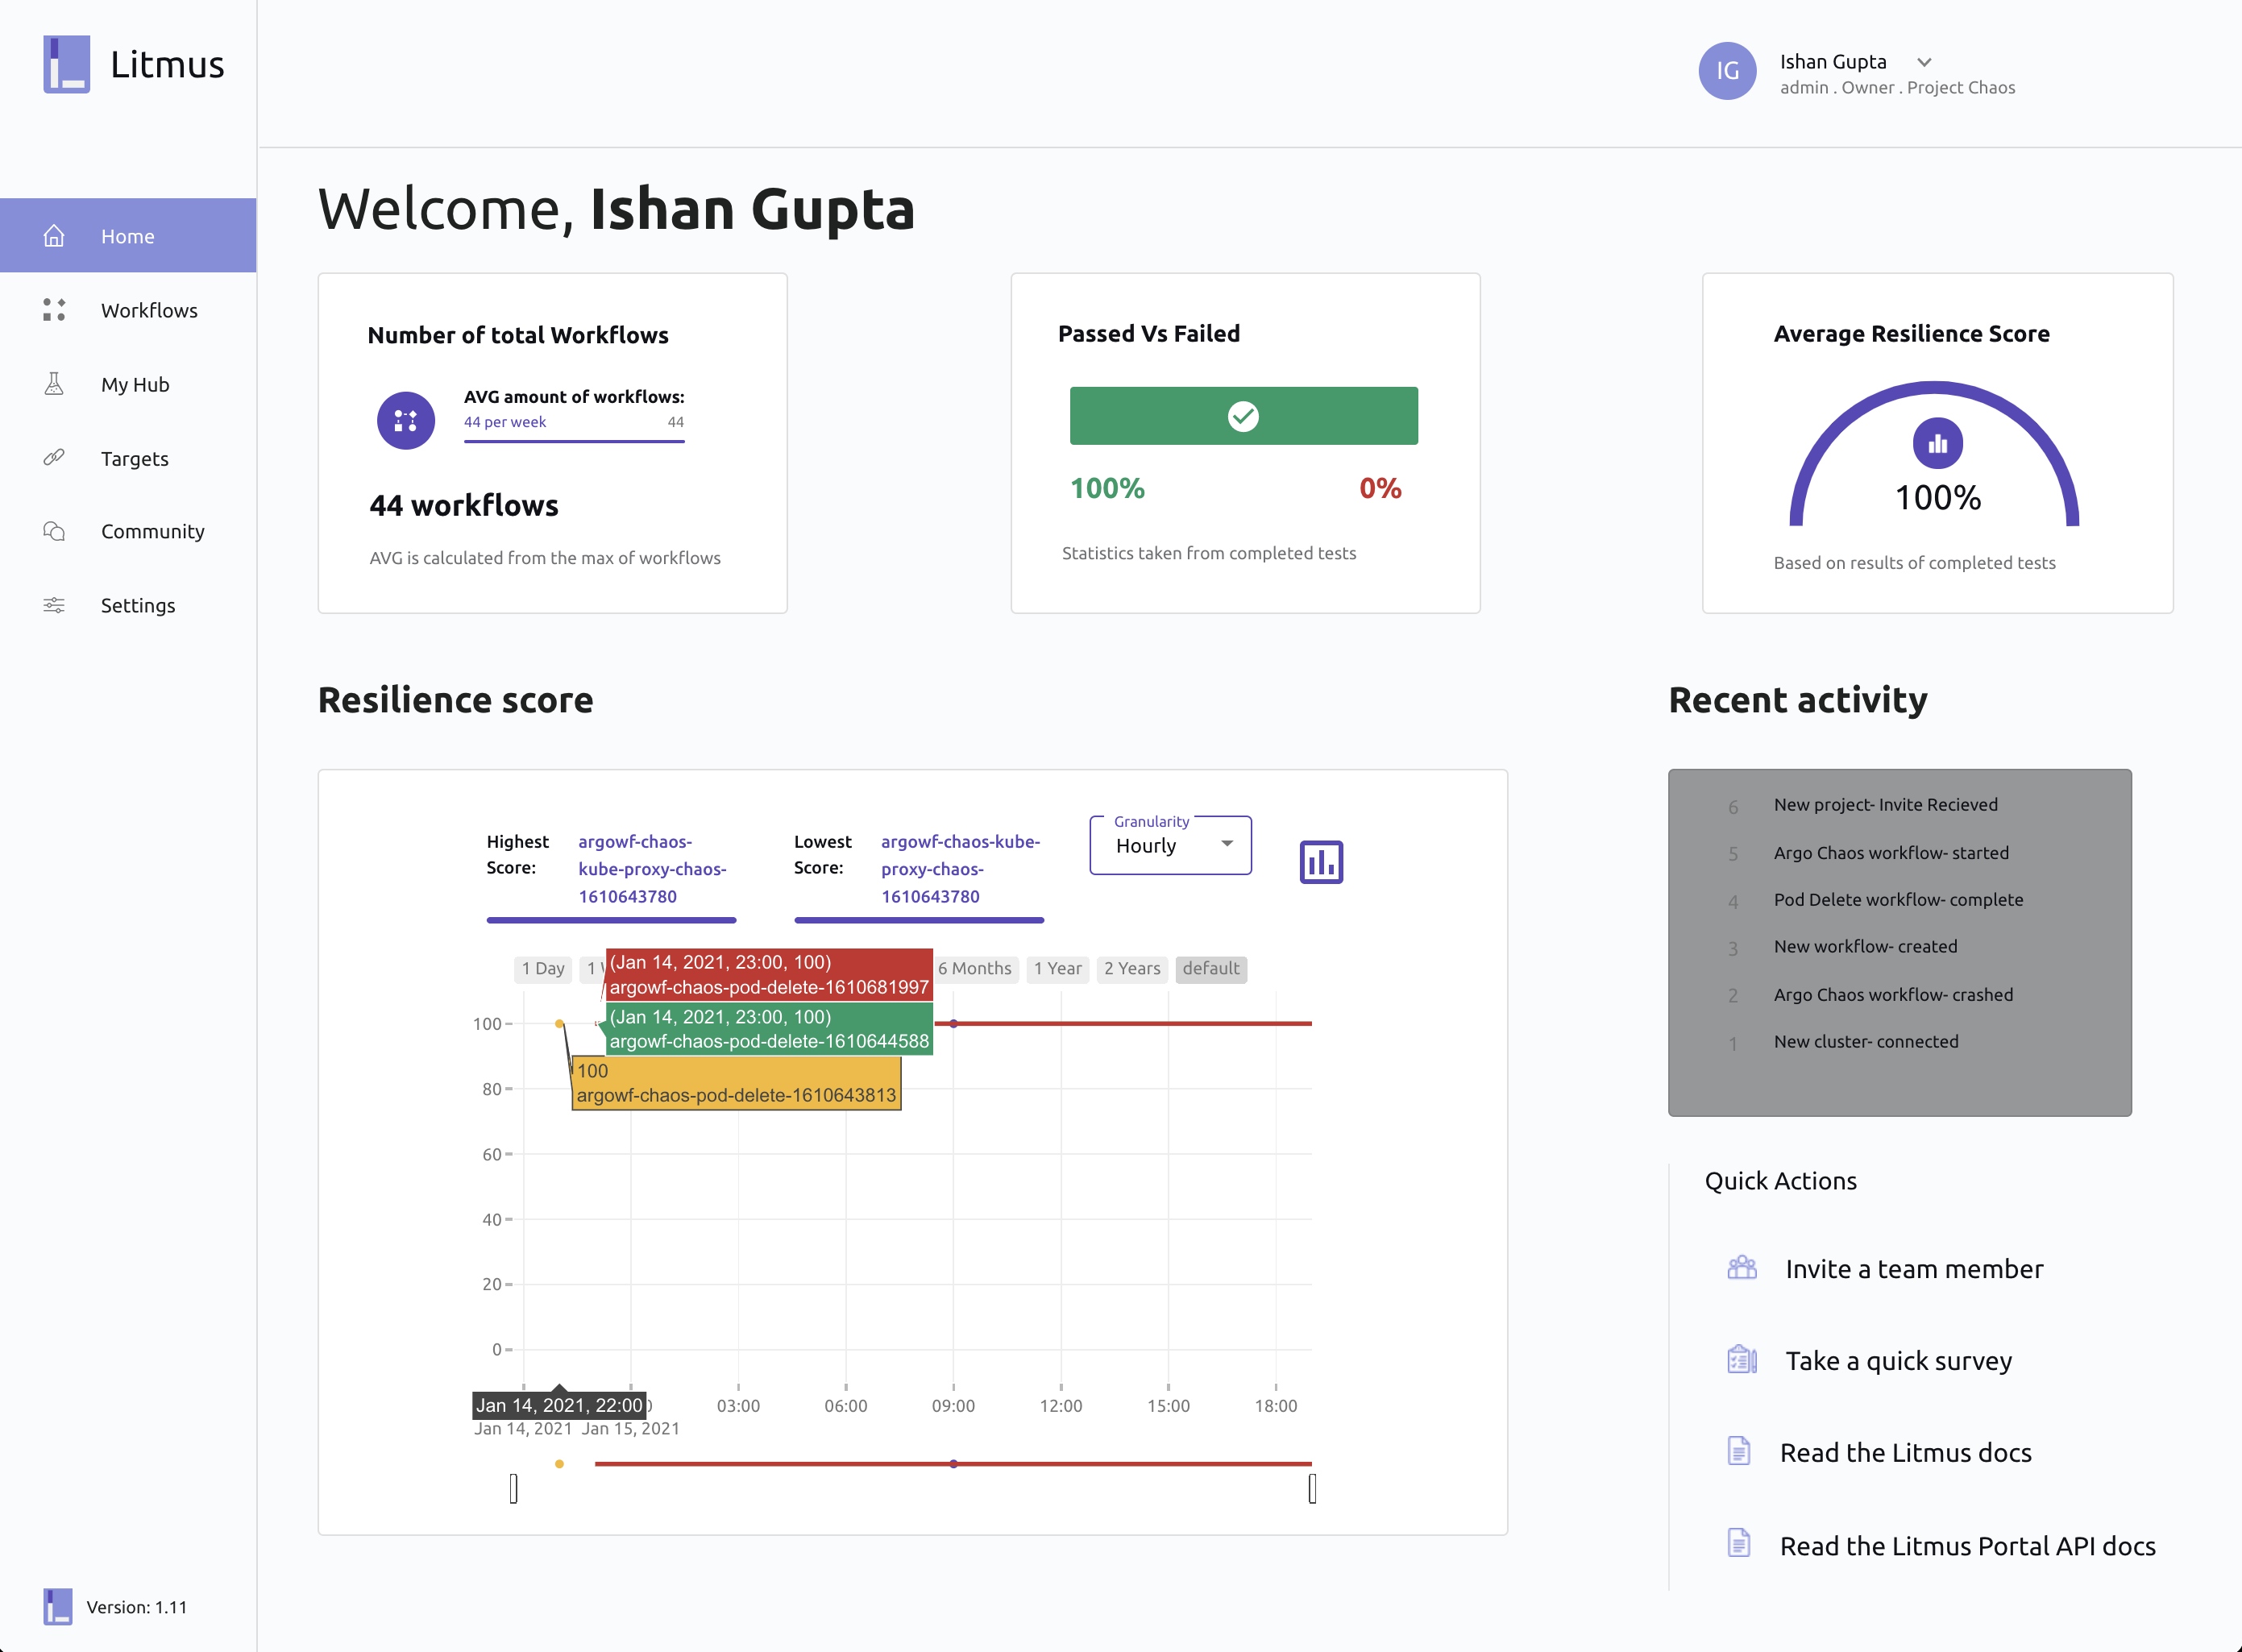
The portal automatically detects scheduled chaos workflows on all connected clusters for a project and plots resilience score comparison graphs for your recent workflow runs. The home screen also features aggregate chaos workflow runs over weeks and the total number of workflows running on all connected clusters. The home screen is not just restricted to a periodic analysis of workflow runs but it also provides granular insight from chaos result schemas of various chaos experiments and chaos engines custom resources. You can get the percentage of passed and failed chaos tests for your project and an average resilience score gauge for the same. All test results are consolidated and condensed from weighted averages of chaos results which the user tunes and assigns weights to while scheduling a new chaos workflow using Litmus Portal, depending on the architectural or operational priorities. These features make the home page the best place to gain an overview and collective insights. The trends on workflow comparison graph and various options provided for switching between granularity of the selected period increases the ease of usability.
- A view of Home screen analytics on Litmus Portal

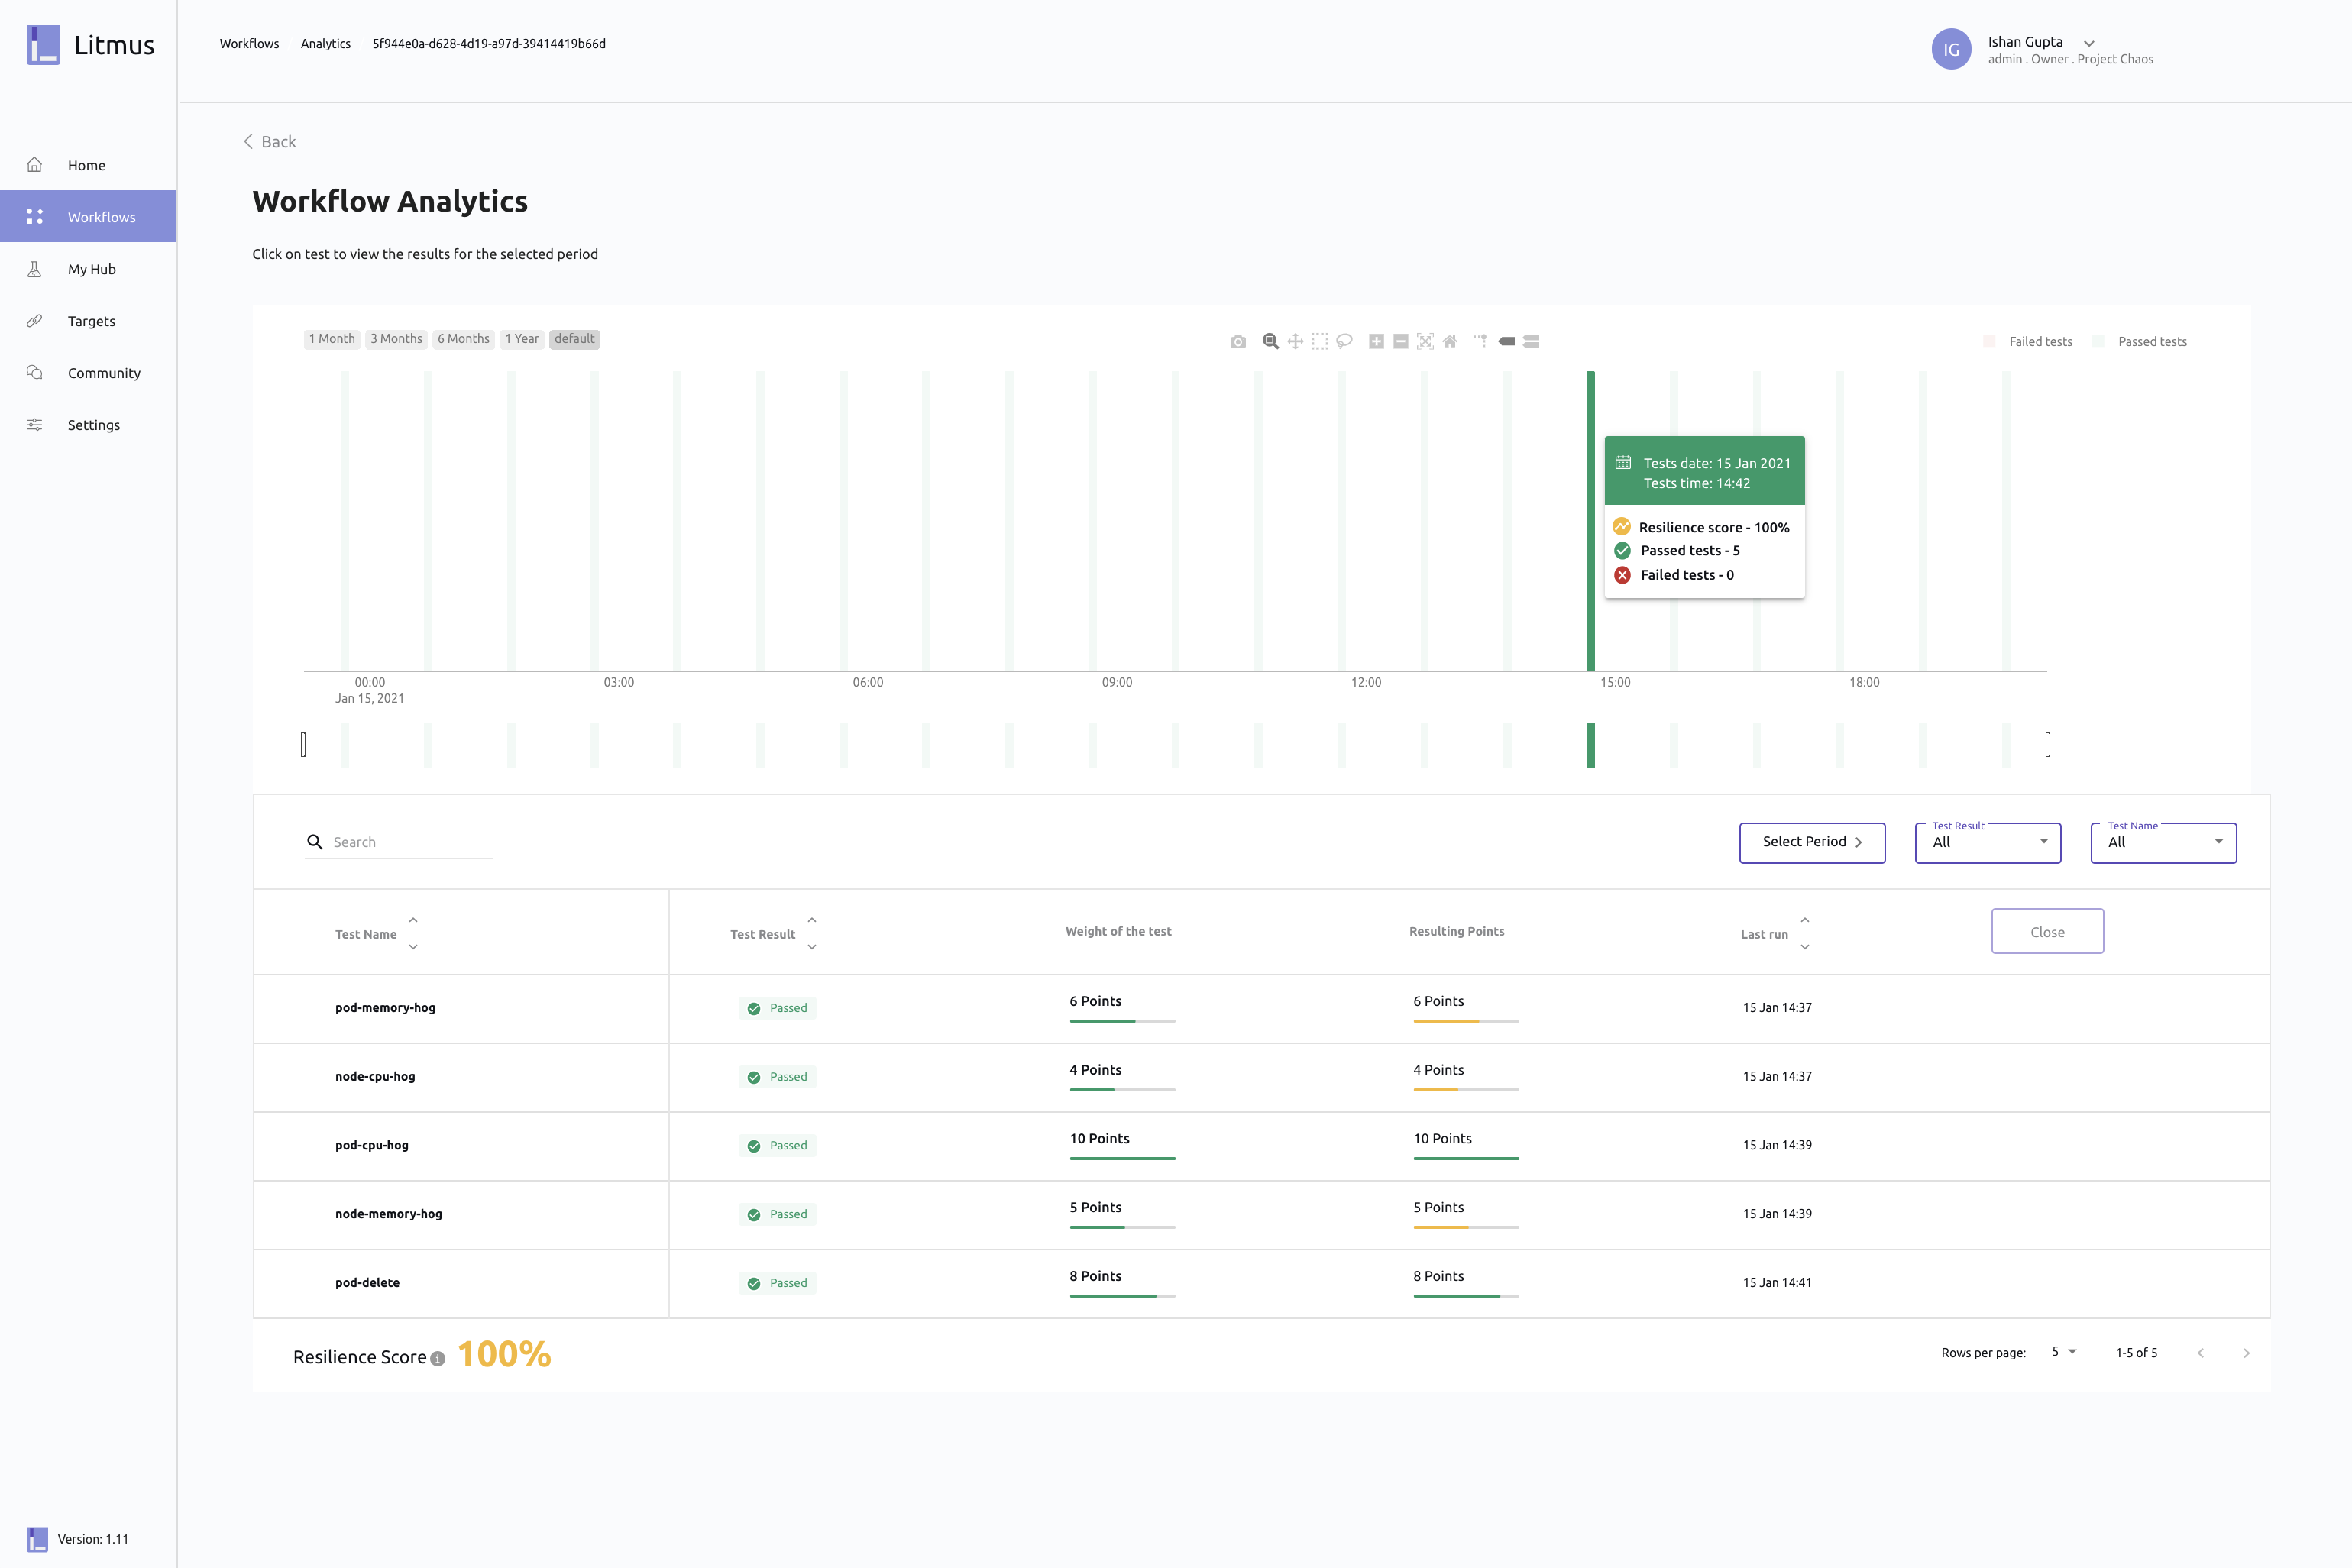
- Apart from the home page, the analytics table under
Workflowssection of the portal has workflow level analytical bar graphs for tracking and visualizing the total number of passed and failed experiments per workflow run with time in the abscissa.

- This graph provides exporting feature and also selective zooming for filtering and scanning through the workflow run bars.

- On clicking the bars you can get a detailed summary of the experiments performed and their results after the run.

- Hovering over them you get a pop-over with a basic overview and stats related to the run.

- The portal provides a core reporting utility and enables you to compare the workflow runs of selected schedules across connected clusters for a project. The average workflow curve is centric to the reliability of the application under test (AUT) over a time duration. You can switch between granularity level to vary the consolidation and aggregation.


- The reporting also comes in handy with the other features available in Litmus Portal for analysing chaos workflows, automated report generation for selected chaos workflows on the click of a button, makes the life of an SRE and the engineering team a lot simpler, eliminating the need of manual record updates and tracking. Workflow run details table and a workflow schedules table with resilience score comparison graph is informative and conclusive of your application’s behaviour under chaotic conditions.


- Link to a sample report- https://drive.google.com/file/d/1-BaFJtJ2tre2vyr1d5KSnv5BcHTGteIX/view?usp=sharing
Stay tuned for the updates on enhanced analytics and real-time monitoring capabilities coming soon to LitmusChaos GUI a.k.a Limtus Portal :-)
Join the Community
Are you an SRE or a Kubernetes enthusiast? Does Chaos Engineering excite you?
Join our community on Slack for detailed discussion, feedback & regular updates On Chaos Engineering For Kubernetes, To join, our slack please follow the following steps!
-
Join the Kubernetes slack using the following link: https://slack.k8s.io
-
Join the #litmus channel on the Kubernetes slack or use this link after joining the Kubernetes slack: https://slack.litmuschaos.io
Check out the LitmusChaos GitHub repo and do share your feedback: https://github.com/litmuschaos/litmus Submit a pull request if you identify any necessary changes.
